Foreword
Because the cost of bringing a new drug to the market is very high, the amount of drugs a drug company can develop is limited. For this reason, in the early stages of drug development, complex screening techniques were mostly used to eliminate candidate drugs that had no potential. To be successful, a rapid and accurate assessment of the absorption, distribution, metabolism, excretion, and toxicity (ADME/Tox) of metabolites and impurities must be performed to characterize the lead compound. High-throughput analysis of impurity samples poses challenges for low-concentration samples, especially low-concentration samples in biological matrices. Various possible modifications make the interpretation of the data further complicated. The Finnigan LCQ Series Ion Trap Mass Spectrometers are highly sensitive, highly selective, and complex data-related, and are well suited to the needs of impurity analysis in pharmaceuticals. The ability to quickly acquire, analyze, and analyze structural data in combinatorial chemistry studies is critical to the smooth progress of compound screening. Mass Frontier, an advanced software package for thermoelectric analysis and processing of mass spectral data, is configured to give predictions of the fragmentation pathways of the molecular structures provided. In the study of this paper, a fragmentation and mechanism module was used to determine the structure of three impurities in a key intermediate of a lead drug.
aims
Structural identification of the chemical structure of the impurities of a key intermediate of a lead drug.
Experimental condition
Drug samples for analysis were provided by the Eisai Institute. All experiments were performed in the APCI mode on a Finnigan LCQ ion trap mass spectrometer. Liquid chromatographic separation analysis was performed using a Finnigan SurveyorTM liquid chromatograph and an AQUASIL C18 (250 x 2 mm) column. Liquid chromatography conditions: 40% water and 60% acetonitrile mobile phase, isocratic elution, flow rate 300 ul / ml, splitless (into mass spectrometry).
The ion source parameters for the Finnigan LCQ mass spectrometer are as follows:
Ionization mode: positive ion, APCI
Heating capillary temperature: 175 ° C
Evaporation temperature: 325 °
CAPCI current: 5μA
Sheath gas pressure: 80 units
Auxiliary gas pressure: 20 units
Mass Frontier software provides an advanced analysis toolkit designed to speed up spectral analysis. As a fragmentation and mechanism module of one of the eight modules, the fragmentation pathway and reaction mechanism can be automatically predicted based on the chemical structure provided by the user. Based on an algorithm for simulating single-molecule ion dissociation reactions, the Fragmentation and Mechanism module contains known reaction mechanisms for electron bombardment ionization, protonation, and chemical ionization.
The main functions of the Fragmentation and Mechanism module are:
● Check the correlation between the chemical structure provided and the experimentally obtained mass spectrum
● Confirm the results of the library search
● Identify structural differences in the most relevant compounds in the mass spectrum
In addition, the Fragmentation and Mechanism module can simulate secondary mass spectrometry experiments. When the user enters the specified compound structure, a series of theoretical fragment ions are generated and compared to the secondary mass spectrometry experimental data. In this study, correlation analysis was performed between the fragment ions generated by the hypothetical chemical structure simulation and the product ions observed in the data-dependent secondary mass spectrometry experiments, confirming the structure of three trace impurities in the key intermediates of the lead drug.
discuss
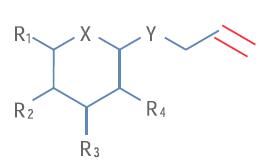
For the recent process evaluation of a key lead intermediate, the Eisai Institute believes that an in-depth analysis of the intermediate impurity structure is necessary before starting the next step. For the sake of property rights, Figure 1 only shows the partial structure of this compound. Inject 20 μL (containing 100 ng/μL of drug intermediate and its impurities) into the chromatographic system for elution separation
After entering the mass spectrometer for detection. The LCQ mass spectrometer uses a data-dependent secondary mass spectrometry scan mode in which full-scan mass spectrometry and secondary mass spectrometry data can be acquired in one run of analysis without the need to pre-specify the mass of the parent ion of the secondary mass spectrometer.
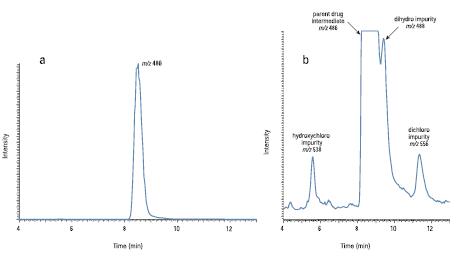
Figure 2a shows the total ion chromatogram of the analysis. The drug intermediate has a strong signal at the mass-to-charge ratio m/z486, with a corresponding retention time of 8.5 minutes. In addition, background ions (not related to the sample) m/z 391, 392 and 393 were observed. After subtracting these background ions from the total ion chromatogram, three chromatograms with impurity m/z of 538, 488 and 556 were obtained (see Figure 2b). Based on the difference in mass number and the isotope profile, it is inferred that three impurities are added to the double bonds of the drug intermediate, respectively, ClOH, H2, and Cl2 (marked in red in Figure 1).
Figure 2. (a) Total scan total ion chromatogram of drug intermediate ( m/z 486) with retention time of 8.5 minutes (b) background subtraction ( m/z 391, 392, and 393) and drug intermediate ( m/) Low concentration impurities ( m/z 538, 488 and 556) ion flow diagram after z 486 and 487)
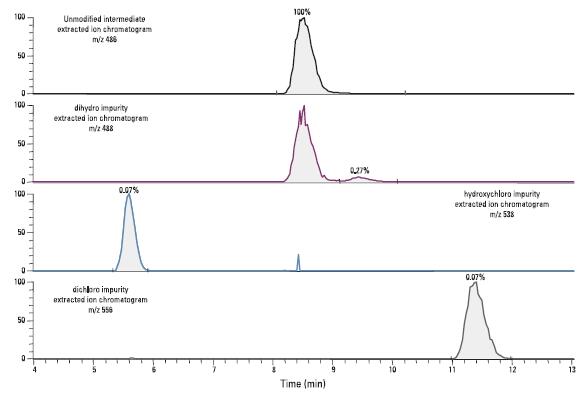
Figure 3 shows the inferred structure of three impurities, Figure 4 shows the isotope distribution of the three impurities and the inferred structure isotope distribution, and Figure 5 shows the extracted ion chromatogram of the drug intermediate and three impurities. The signal intensity of the two chlorine-containing impurities is 0.1% of the unmodified intermediate. Due to the high sensitivity and signal-to-noise ratio of the instrument, four compounds were detected in a data-dependent secondary mass spectrometry experiment. Dynamic exclusion is another feature of data-related acquisition. Low-level components can collect secondary mass spectrometry data even when they are co-eluted with high-intensity components. This function is suitable for low-level impurity analysis.

Figure 3. The chemical structure of the three impurities is inferred to be: (a) hydroxylated chlorine impurities (b) dihydrogen impurities and (c) dichloride impurities
Figure 4. Experimental and theoretical isotope distribution comparison of three impurities (a) hydroxylated chlorine impurities (b) dihydrogen impurities and (c) dichloride impurities. On the left is the experimentally scanned full-isolated isotope profile, and on the right is the theoretical isotope profile calculated from the Isotope Viewer in the XcaliburTM software for a given elemental composition.
Figure 5. Extracted ion chromatogram of the drug intermediate and three impurities, the impurities are calculated as relative peak areas.
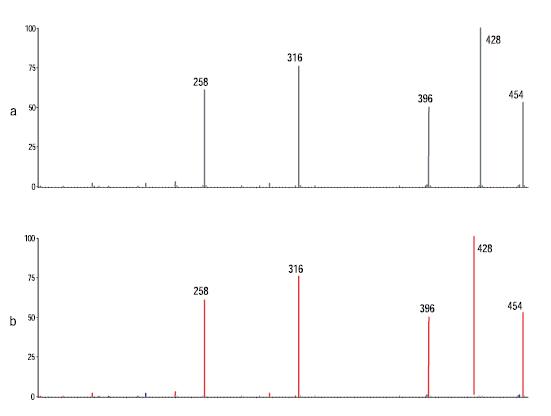
If there is no dynamic exclusion function, the secondary mass spectral data of the dihydrogen impurity is not collected because the intensity of the unmodified intermediate co-eluting with the dihydrogen impurity is higher. In the secondary mass spectrometry data scan, ions in the m/z 391, 392, and 393 are excluded from the list to avoid secondary mass spectrometry of background ions. Since data acquisition is used to collect data, it is not necessary to enter the mass of the parent ion of the specified secondary mass spectrometer in the method. This avoids the need to perform a full scan first and then manually find the mass of the parent ion required for the secondary mass spectrometry scan. For low-concentration component analysis, this process is time consuming and causes experimental errors. In Figure 6, the Mass Frontier Spectral Management window displays secondary mass spectral data of the collected drug intermediates before and after comparison with the Fragmentation and Mechanism Module predictions. In particular, after entering the chemical structure of the drug intermediate, the software uses known single-molecule dissociation reaction patterns to predict possible secondary mass spectrometry fragment ions. These theoretically predicted secondary mass spectrometry fragments were then matched to experimental data for analysis. Figure 6 shows all the major secondary mass spectrometry fragment peaks given by the program, demonstrating the effectiveness of fragmentation and mechanism algorithms for the prediction of secondary chemical mass spectra for a given chemical structure.
Figure 6: (a) Secondary mass spectrum obtained from drug intermediate experiments. (b) Matching theoretically predicted fragment ions, where the fragment ions predicted by Mass Frontier are marked in red on the spectrum.
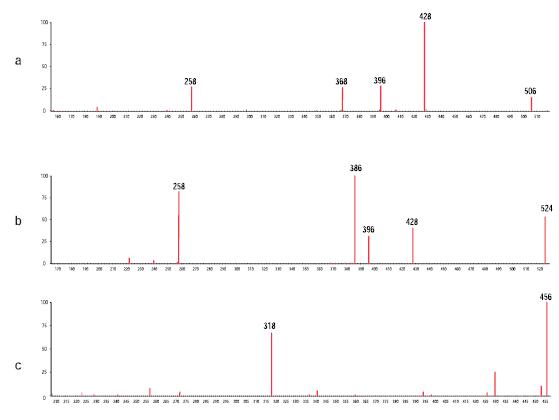
Figure 7: Experimental secondary mass spectrum obtained after matching the predicted fragment ions (a) Chlorine hydroxyl impurities (b) Dichloro impurities and (c) Dihydrogen impurities, experimental fragment ions matched with Mass Frontier software predictions in red mark
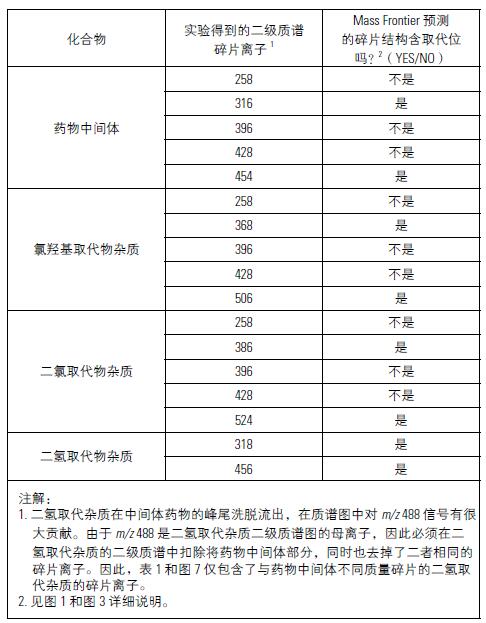
Figure 7 is an experimental secondary mass spectrum of three impurities compared to the predicted fragment ions. Mass Frontier's predictions are based on the structure of the three impurity inferences in Figure 3. As in Figure 6, the predicted fragment ions and the ion matching in the experimental secondary mass spectrum are marked in red. It can be seen that all the major ions of the experimentally obtained secondary mass spectrum are marked in red, which strongly supports the validity of the inferred structure. Table 1 summarizes the correlation results between the Mass Frontier software predicted fragment structure and the experimental secondary mass spectrum to verify the inferred impurity structure in Figure 3. In order to understand how to obtain such results, it must be realized that the proposed drug intermediate structure and the three impurity structures are similar except for the position at which the substitution occurs (the red marks in Figures 1 and 3). Therefore, if the two mass spectra of the four compounds obtained in the experiment have specific fragment ions, and Mass Frontier predicts the same cracking mechanism, then the proposed three impurity structures are correct:
• If the Mass Frontier software predicts that the fragmentation structure generated by the fragmentation mechanism does not contain a substitution site, then the fragment ions of the same mass-to-charge ratio should be present in the four secondary mass spectra obtained from the experiment.
● If Mass Frontier software predicts that the fragmentation structure generated by the fragmentation mechanism contains a substitution site (ie, if the mass-to-charge ratio of the fragment ions of the drug intermediate in the secondary mass spectrum obtained in the experiment is M, then in dihydrogen, chlorohydroxy, and The chlorine-substituted impurities should have M+2, M+52 and M+70 mass-to-charge ratios, respectively, and the mass-to-charge ratio of the fragment ions should be different from the mass of the substituent.
In Table 1, Mass Frontier software specifies that fragment ions with the same cracking mechanism are weighted in the same color. In this way, it can be seen from the table that in all cases, the associated fragment ions obtained by the Mass Frontier prediction formation mechanism either have the same experimental mass-to-charge ratio or have an experimental mass-to-charge ratio different from the substituent, depending on Whether Mass Frontier predicts whether the fragment structure has a substitution bit. The validity of the inferred impurity structure is demonstrated by observation.
Table 1. Mass Frontier software structure prediction summary
in conclusion
Three impurities of the patented pharmaceutical intermediates at 0.1% or less were detected and characterized with the support of data-dependent secondary mass spectrometry mode and dynamic exclusion. Isotopic distribution and poor quality illustrate the rationality of the inferred structure and are verified by Mass Frontier. The proposed three impurity structures were determined by Mass Frontier's prediction of fragment ions and experimentally obtained secondary mass spectrometry ions. This analysis supports the conclusion that all three impurities are derived from chemical substitutions at a double bond position of the drug intermediate.
● The impurity content to be analyzed is less than 0.1% of the abundance of the parent component, which is required by regulations. The Finnigan LCQ Ion Trap Mass Spectrometer is a must-have tool for successful impurity analysis with its high sensitivity and selectivity and data-dependent scanning mode.
● Mass Frontier Spectral Management and Fragmentation Mechanism Module technology enables quick and easy structural analysis and confirmation of inferred impurity structures.
Related Links
Drug Impurity Analysis Solution--Ion Trap Multi-Level Liquid Quality


 Fuxin Custchem Fine Chemical Co., Ltd.
 April 10, 2022